「Matplotlibで作成するグラフはダサい・・・」
「綺麗なネットワーク図を作成したい」
「UbuntuにGraphvizをインストールする必要がある」
このような場合には、この記事の内容が参考となります。
この記事では、UbuntuへGraphvizをインストールする方法を解説しています。
本記事の内容
- Graphvizとは?
- Graphvizのシステム要件
- Graphvizのインストール
- Graphvizの動作確認
それでは、上記に沿って解説していきます。
Graphvizとは?
Graphvizは、オープンソースのグラフ可視化ソフトウェアです。
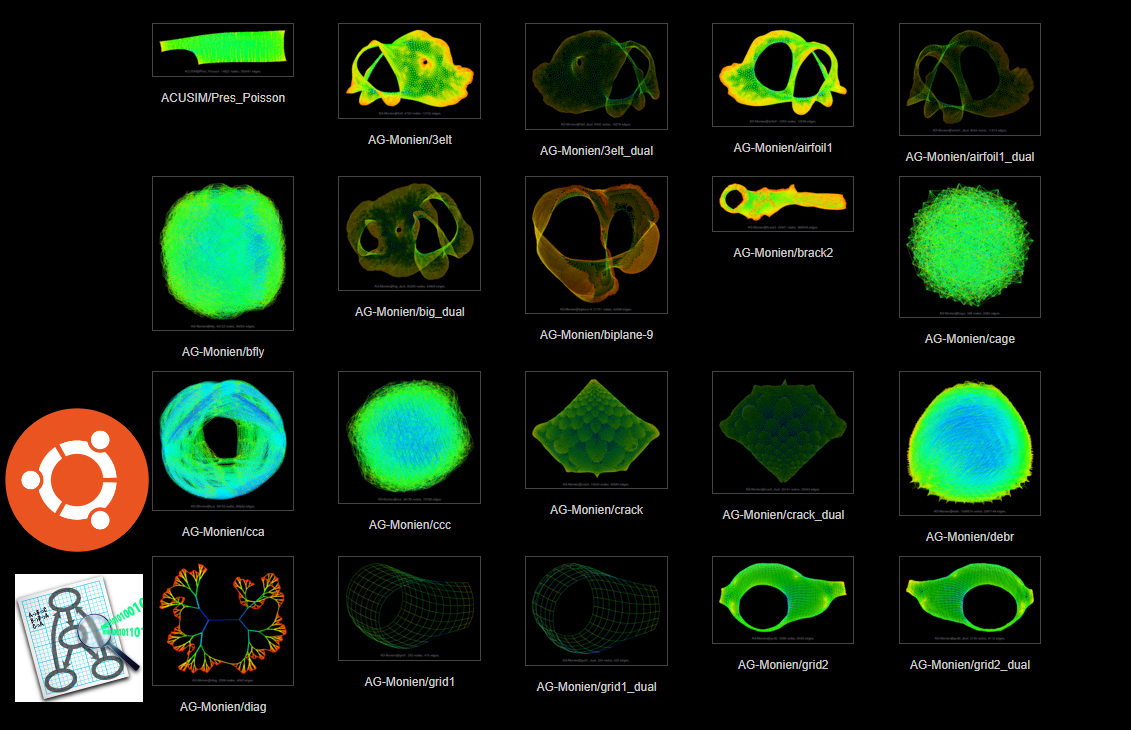
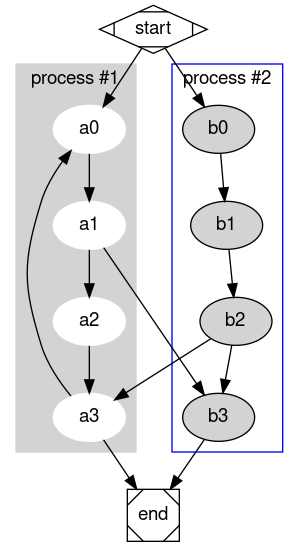
Graphvizを用いれば、次のようなグラフを作成することができます。
Graphvizを利用すべきメリットは、次の記事で説明しています。

以上、Graphvizについての説明でした。
次は、Graphvizのシステム要件を確認します。
Graphvizのシステム要件
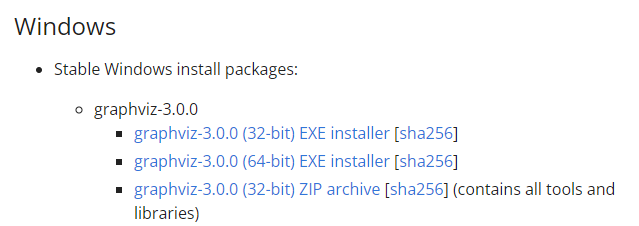
現時点(2022年4月)でのGraphvizの最新バージョンは、3.0.0となります。
この最新バージョンは、2022年2月26日にリリースされています。
Windowsであれば、最新版をダウンロードすればいいだけです。
しかし、今回はUbuntuへGraphvizをインストールします。
そうなると、そうそう簡単に最新版はインストールできません。
もちろん、ソースコードからビルドすれば最新版をインストールできます。
ただ、ソースコードからのインストールは避けるべきです。
ソースコードからのインストールは、トラブルの元になります。
まず、そこまでのリスクを負って最新版のGraphvizを使いたいかどうかです。
今回は、そんなリスクを負いたくありません。
よって、OS標準のバージョンをインストールします。
Ubuntu 20.04を検証に用いています。
$ cat /etc/lsb-release
DISTRIB_ID=Ubuntu
DISTRIB_RELEASE=20.04
DISTRIB_CODENAME=focal
DISTRIB_DESCRIPTION="Ubuntu 20.04.4 LTS"
以下がOS標準のGraphvizとなります。
それぞれのOS毎に決まっています。
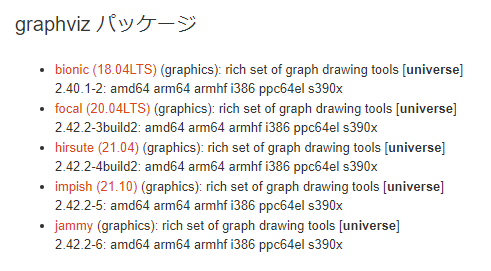
Ubuntu 20.04は、Graphviz 2.42.2となります。
以上、Graphvizのシステム要件を説明します。
次は、Graphvizのインストールを説明します。
Graphvizのインストール
まずは、パッケージの確認です。
$ sudo apt info graphviz
Package: graphviz
Version: 2.42.2-3build2
Priority: optional
Section: universe/graphics
Origin: Ubuntu
Maintainer: Ubuntu Developers <ubuntu-devel-discuss@lists.ubuntu.com>
Original-Maintainer: Laszlo Boszormenyi (GCS) <gcs@debian.org>
Bugs: https://bugs.launchpad.net/ubuntu/+filebug
Installed-Size: 3,175 kB
Depends: libann0, libc6 (>= 2.15), libcdt5, libcgraph6, libexpat1 (>= 2.0.1), libgcc-s1 (>= 3.0), libgd3 (>= 2.1.0~alpha~), libglib2.0-0 (>= 2.16.0), libgts-0.7-5 (>= 0.7.6), libgvc6 (>= 2.42.1), libgvpr2, liblab-gamut1, libstdc++6 (>= 5), libx11-6, libxaw7, libxmu6, libxt6
Recommends: fonts-liberation
Suggests: gsfonts, graphviz-doc
Homepage: https://www.graphviz.org/
Download-Size: 590 kB
APT-Sources: http://archive.ubuntu.com/ubuntu focal/universe amd64 Packages
Description: rich set of graph drawing tools
 Graph drawing addresses the problem of visualizing structural information
 by constructing geometric representations of abstract graphs and networks.
 Automatic generation of graph drawings has important applications in key
 technologies such as database design, software engineering, VLSI and
 network design and visual interfaces in other domains. Situations where
 these tools might be particularly useful include:
 .
   * you would like to restructure a program and first need to understand
     the relationships between its types, procedures, and source files
   * you need to find the bottlenecks in an Internet backbone - not only
     individual links, but their relationships
   * you're debugging a protocol or microarchitecture represented as a
     finite state machine and need to figure out how a certain
     error state arises
   * you would like to browse a database schema, knowledge base, or
     distributed program represented graphically
   * you would like to see an overview of a collection of linked documents
   * you would like to discover patterns and communities of interest in a
     database of telephone calls or e-mail messages
確かに、「2.42.2-3build2」がaptでは認識されていますね。
では、このパッケージをインストールします。
$ sudo apt-get update
$ sudo apt install -y graphviz
Graphvizのインストールは、すぐに終わります。
以上、Graphvizのインストールを説明しました。
次は、Graphvizの動作確認を行います。
Graphvizの動作確認
最初に、Graphvizのバージョンを確認します。
dot -V
上記コマンドを実行した結果は、以下。
$ dot -V
dot - graphviz version 2.43.0 (0)
パッケージ名にあるバージョンとは、若干異なります。
パッケージ名では、「2.42.2-3build2」です。
dotコマンドの利用方法は、ヘルプで確認できます。
$ dot -h
Error: dot: option -h unrecognized
Usage: dot [-Vv?] [-(GNE)name=val] [-(KTlso)<val>] <dot files>
(additional options for neato)    [-x] [-n<v>]
(additional options for fdp)      [-L(gO)] [-L(nUCT)<val>]
(additional options for memtest)  [-m<v>]
(additional options for config)  [-cv]
 -V          - Print version and exit
 -v          - Enable verbose mode
 -Gname=val  - Set graph attribute 'name' to 'val'
 -Nname=val  - Set node attribute 'name' to 'val'
 -Ename=val  - Set edge attribute 'name' to 'val'
 -Tv         - Set output format to 'v'
 -Kv         - Set layout engine to 'v' (overrides default based on command name)
 -lv         - Use external library 'v'
 -ofile      - Write output to 'file'
 -O          - Automatically generate an output filename based on the input filename with a .'format' appended. (Causes all -ofile options to be ignored.)
 -P          - Internally generate a graph of the current plugins.
 -q[l]       - Set level of message suppression (=1)
 -s[v]       - Scale input by 'v' (=72)
 -y          - Invert y coordinate in output
 -n[v]       - No layout mode 'v' (=1)
 -x          - Reduce graph
 -Lg         - Don't use grid
 -LO         - Use old attractive force
 -Ln<i>      - Set number of iterations to i
 -LU<i>      - Set unscaled factor to i
 -LC<v>      - Set overlap expansion factor to v
 -LT[*]<v>   - Set temperature (temperature factor) to v
 -m          - Memory test (Observe no growth with top. Kill when done.)
 -m[v]       - Memory test - v iterations.
 -c          - Configure plugins (Writes $prefix/lib/graphviz/config
               with available plugin information.  Needs write privilege.)
 -?          - Print usage and exit
とりあえず、Graphvizが動作できることは確認できました。
これでGraphvizの動作確認は十分でしょう。
なお、Windowsと異なり、パスの設定は不要です。
実行ファイルが、以下の場所に設置されています。
$ which dot
/usr/bin/dot
Linuxの場合は、パス云々の面倒なことを考慮する必要はありません。
以上、Graphvizの動作確認を説明しました。